pychemcurv.vis
The pychemcurv.vis module implements the CurvatureViewer
class in order to visualize a molecule or a periodic structure in a jupyter
notebook and map a given properties on the atoms using a color scale.
This class needs, nglview and uses ipywidgets in a jupyter notebook to display the visualization. Run the following instructions to install nglview and achieve the configuration in order to be able to use nglview in a jupyter notebook
conda install nglview -c conda-forge
jupyter-nbextension enable nglview --py --sys-prefix
or
pip install nglview
jupyter-nbextension enable nglview --py --sys-prefix
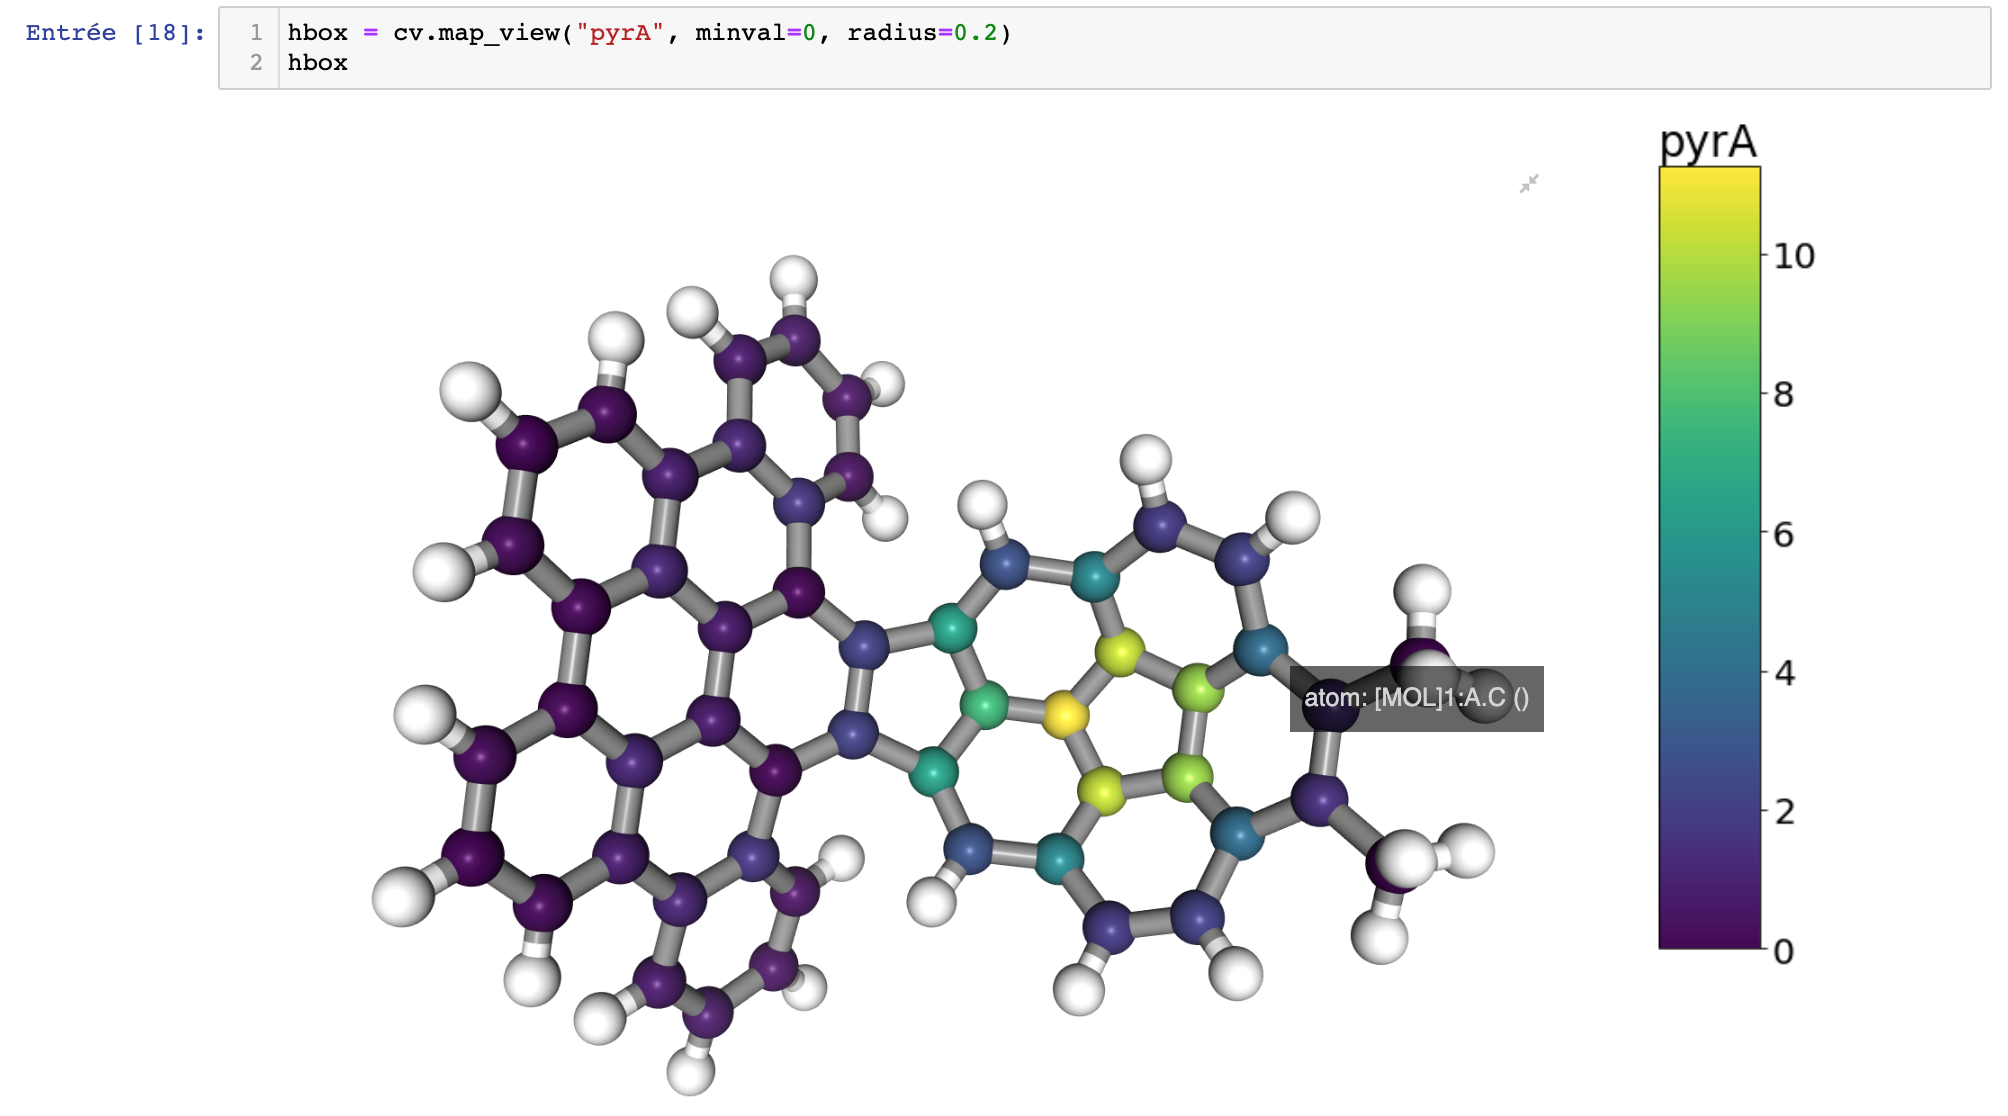
Visualization of the pyramidalization angle using a color scale.
CurvatureViewer class
- class pychemcurv.vis.CurvatureViewer(structure, bond_tol=0.2, rcut=2.5, bond_order=None)[source]
This class provides a constructor for a NGLView widget in order to visualize the wanted properties using a color scale mapped on the 3D structure of the molecule or the structure.
The class needs a pymatgen.Structure or pymatgen.Molecule object as first argument. The other arguments are used to defined if two atoms are bonded or not.
- Parameters
structure (Structure, Molecule) – A Structure or Molecule pymatgen objects
bond_tol (float) – Tolerance used to determine if two atoms are bonded. Look at pymatgen.core.CovalentBond.is_bonded.
rcut (float) – Cutoff distance in case the bond is not not known
bond_order (dict) – Not yet implemented
- get_view(representation='ball+stick', radius=0.25, aspect_ratio=2, unitcell=False, width='700px', height='500px')[source]
Set up a simple NGLView widget with the ball and stick or licorice representation of the structure.
- Parameters
representation (str) – representation: ‘ball+stick’ or ‘licorice’
radius (float) – bond (stick) radius
aspect_ratio (float) – ratio between the balls and stick radiuses
unitcell (bool) – If True and structure is periodic, show the unitcell.
width (str) – width of the nglview widget, default ‘700px’
height (str) – height of the nglview widget, default ‘500px’
- Returns
Return a
NGLWidgetobject
- map_view(prop, radius=0.25, aspect_ratio=2, unitcell=False, cm='viridis', minval=None, maxval=None, orientation='vertical', label=None, width='700px', height='500px')[source]
Map the given properties on a color scale on to the molecule using a ball and stick representations. The properties can be either the name of a column of the data computed using the CurvatureAnalyzer class, or, an array of values of a custum property. In the last case, the size of the array must be consistent with the number of atoms in the system.
- Parameters
prop (str or array) – name of the properties or values you want to map
radius (float) – bond (stick) radius
aspect_ratio (float) – ratio between the balls and stick radiuses
unitcell (bool) – If True and structure is periodic, show the unitcell.
cm (str) – colormap from
matplotlib.cm.minval (float) – minimum value to consider for the color sacle
maxval (float) – maximum value to consider for the color sacle
orientation (str) – orientation of the colorbar
'horizontal'or'vertical'label (str) – Name of the colorbar. If None, use prop.
width (str) – width of the nglview widget, default ‘700px’
height (str) – height of the nglview widget, default ‘500px’
- Returns
Returns an ipywidgets
HBoxorVBoxwith theNGLWidgetand a color bar associated to the mapped properties. TheNGLWidgetis the first element of the children, the colorbar is the second one.